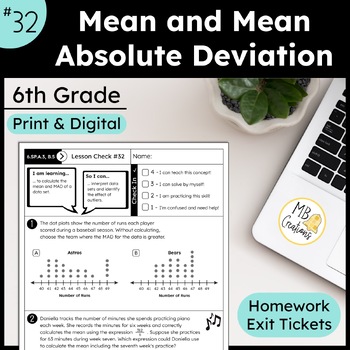
Statistical literacy requires understanding two distinct dimensions of a distribution: where the middle sits and how widely the surrounding values scatter. The mean serves as the primary measure of center for symmetrical data, representing an equitable balance point where the sum of positive deviations equals the sum of negative deviations.
Center alone can conceal critical realities. A student scoring 50% and 100% on two exams shares the exact same 75% mean as a student scoring 74% and 76%. This is where measures of variability step in.
Mean Absolute Deviation (MAD) calculates the average distance of all observations from the mean. Instead of squaring differences, as seen in high school standard deviation, seventh-grade math keeps the math grounded through absolute values:
$$\text{MAD} = \frac{\sum |x - \bar{x}|}{n}$$
A lower MAD signals high consistency, clustering data points tightly around the center. A high MAD reflects wide statistical spread, showing volatile values prone to swinging far from the arithmetic baseline. When an i-Ready prompt displays side-by-side dot plots, a wider spread directly flags higher data set variability.

